
The Brain Architecture of Schizophrenia-Bipolar Psychosis Spectrum
B-SNIP Biotypes of Psychosis


There has been a quiet transformation in how we understand the biology of psychotic disorders like schizophrenia and bipolar with psychosis, and I am surprised more people in the mental health field aren’t talking about it. Genome-wide association studies and neuroimaging methods have attracted a lot more attention and have generally under-delivered, but a large-scale, sustained, methodical effort to characterize cognition and brain electrophysiology across the spectrum of psychotic disorders has been fruitful.
I am talking here about the Bipolar-Schizophrenia Network for Intermediate Phenotypes, known as B-SNIP, a multi-site North American research consortium, established in 2007, that set out to find biological markers of psychosis and to understand the role of cognition and brain functioning across psychotic disorders. They have been investigating whether biological patterns emerge that offer mechanistic clues and suggest treatments (they do) and whether they respect our diagnostic boundaries (they don’t).
There are two headline results:
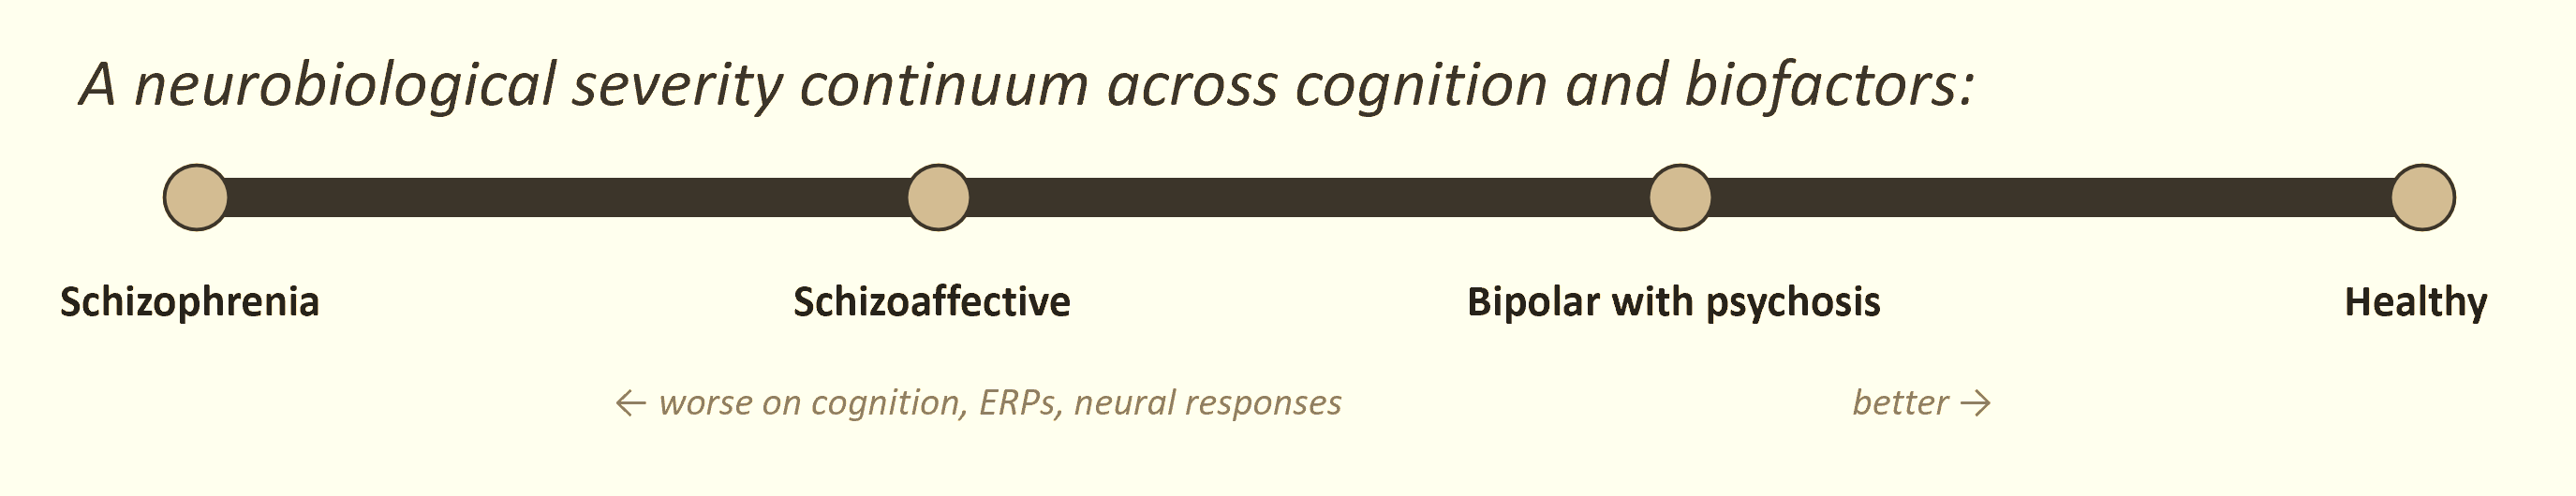
Demonstration of a neurocognitive severity continuum that loosely aligns with the schizophrenia-bipolar psychosis spectrum, and
Three biologically defined subgroups of psychosis, i.e., “biotypes,” with distinctive cognitive and neurophysiological profiles.
The B-SNIP biotypes have been recognized by the Future DSM committee as among the most promising candidate biomarkers we currently possess.
This post is about how B-SNIP biotypes were discovered, what they appear to show, and how I make sense of them.
The B-SNIP Project
Three methodological choices are key to B-SNIP.
The first is large, transdiagnostic samples, consisting of the diagnosis of schizophrenia, schizoaffective disorder, and bipolar disorder with psychosis (diagnoses were based on DSM-IV). Over thirteen years the consortium recruited more than 700 people with schizophrenia, over 500 with schizoaffective disorder, more than 700 with bipolar disorder with psychosis, and more than 900 healthy community members. This was done as two separate samples of more than ~900 people each, collected years apart, so that any finding in the first sample could be tested for replication in the second.
The second was dense, multi-level measurement. Each participant was assessed across cognition, brain electrophysiology, structural and functional brain imaging, molecular and inflammatory markers, and clinical and social functioning. The core battery that defined the biotypes drew on the following:
Brief Assessment of Cognition in Schizophrenia (BACS) for general cognitive performance;
Stop Signal Task for motor inhibition;
Pro- and antisaccade eye-movement tasks for visual orienting and inhibitory control; and
Two auditory EEG paradigms (paired-stimuli and oddball tasks) that measure how strongly and how cleanly the brain responds to sound.
These tasks are what researchers call “endophenotypes,” or “intermediate phenotypes,” measurements that sit partway between genes and clinical symptoms.
The third choice was the use of “bio-factors,” groups of biological measurements, rather than single measures. A bio-factor is a statistical composite that combines several related individual measures. For example, antisaccade response latency and prosaccade response latency both index the speed of visual orienting, so they are merged into a single visual-orienting bio-factor. This is done through principal component analysis, a statistical method that allows for such aggregation. In the end, 44 individual biomarker variables were collected into 9 bio-factors.
The biotypes themselves were created by feeding those 9 bio-factors into a clustering algorithm called k-means, run only on the psychosis cases. K-means looks for groupings in the data, sorting cases so that people within a group are as similar to one another as possible. The number of clusters was not chosen in advance; the researchers used formal statistical procedures to ask how many groups the data actually supported, and the answer, in every analysis, was three.
Researchers then sought to validate these clusters. The k-means solution was obtained separately in the original sample and the replication sample, and the resulting bio-factor patterns were almost identical between them, with an intraclass correlation of 0.95. The ICC of 0.95 compares the group-level profiles, the pattern of bio-factor means across the three biotypes. It asks: if you line up the nine bio-factor averages for biotype 1 in B-SNIP first sample against the nine bio-factor averages for biotype 1 in the replication sample, and do the same for biotypes 2 and 3, how similar are those profiles? An ICC of 0.95 means the shapes of the profiles are nearly identical.
When the researchers took the clustering rule derived in one sample and applied it to the other, cases were sorted into the same groups roughly 89 percent of the time. Here the researchers took the actual k-means decision boundaries learned from one sample and applied them to the raw bio-factor scores of every individual in the other sample, then checked whether each person landed in the same biotype they’d been assigned by the independent clustering of their own sample. The fact that roughly 11% of cases were classified differently tells us something about the fuzziness of boundary regions. There’s a meaningful minority of individuals whose bio-factor profiles sit close enough to the borders between clusters that small differences in where those borders fall can tip them one way or the other.
The three-cluster structure is not a statistical fluke of one dataset. It shows up again, in more or less the same way, in an entirely separate group of patients collected years later.
B-SNIP and DSM Diagnoses
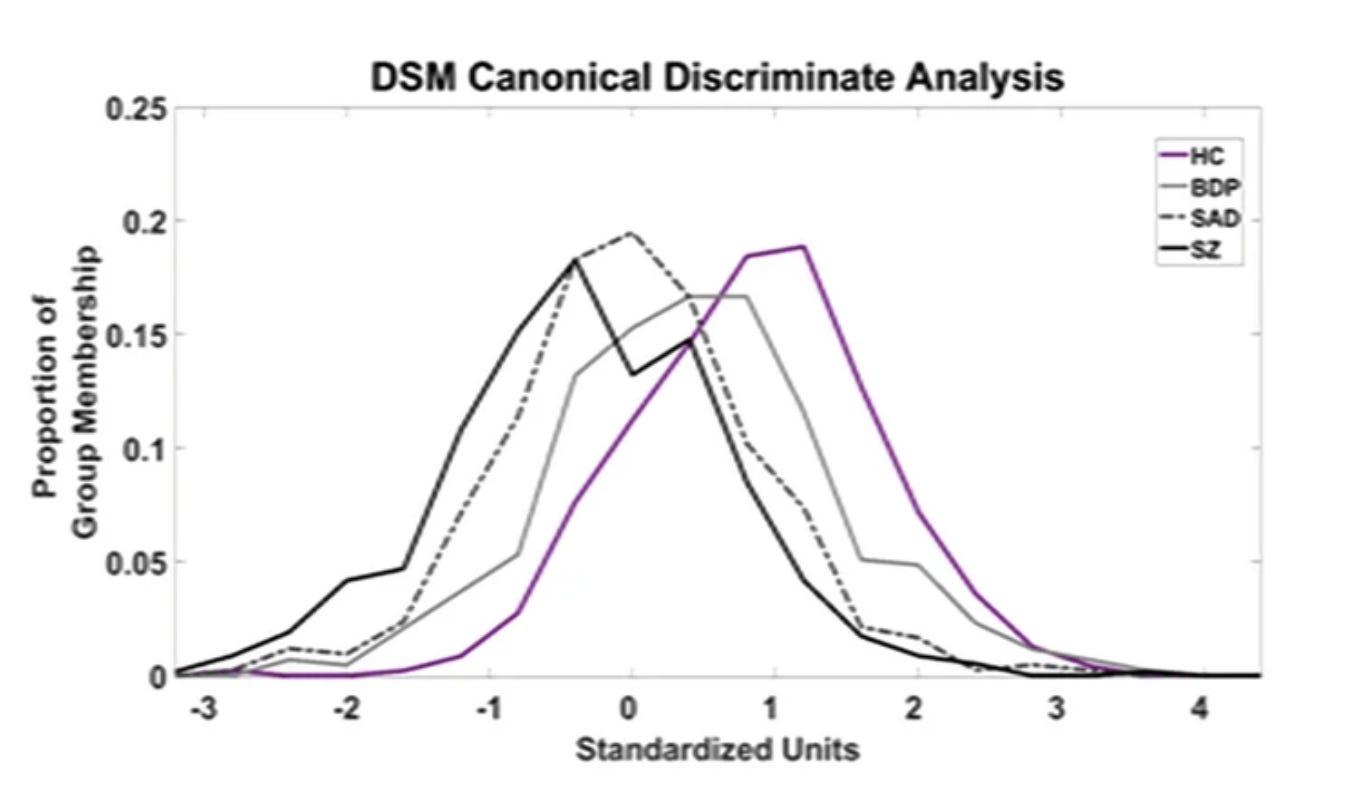
As expected, the DSM categories did not correspond to distinct biological entities. Instead, they lined up along a continuum of severity that appears across multiple bio-factor domains. On cognition, all four groups were significantly differentiated: schizophrenia performed worst, then schizoaffective disorder, then bipolar disorder with psychosis, then healthy participants.
Several neurophysiological measures showed the same gradient but in coarser form. The N100 and P300 brain responses followed the pattern but could not separate the two schizophrenia-spectrum diagnoses from each other. Antisaccade performance could not distinguish schizoaffective from bipolar cases. The paired-stimuli brain response could not separate bipolar cases from healthy participants. The stop signal task separated psychosis cases from healthy people but could not distinguish the three psychosis diagnoses from each other. Saccade latency and ongoing high-frequency brain activity showed no significant differences between the DSM diagnoses.
The differences between the diagnoses were also small in magnitude. On cognition, schizophrenia and bipolar psychosis cases differed by less than half a standard deviation. Even when the researchers combined all nine bio-factors at once to maximize the separation, the gap between the two extreme groups reached only about 0.9 standard deviations. And no biomarker or biofactor deviation was specific to any one DSM diagnosis.
While this neurocognitive continuum spans multiple measurement domains, it is dominated by cognition. When the B-SNIP group asked formally whether all their measures could be captured by a single underlying function, 95.5% of structural MRI variables and 65% of neuropsychology-psychophysiology variables fit one cognition-anchored dimension.
So the DSM psychosis diagnoses, analyzed biologically and cognitively, look less like separate entities and more like different points on a shared gradient of neurocognitive severity.
B-SNIP Biotypes
When the B-SNIP researchers set aside DSM diagnoses and let statistics sort the biological variables into clusters, the three biotypes that emerged did not simply recreate the severity continuum in the same way as DSM categories. They showed different profiles of brain activity.
Biotype 1 (B-SNIP1 n=263, replication n=277): Marked cognitive deficit on the BACS, combined with globally diminished neural response magnitudes (low N100, low P300, low paired-stimuli S2 response), reduced ongoing neural activity, and slowed saccade latencies. The defining signature is a dampened brain that under-responds to stimuli.
Biotype 2 (B-SNIP1 n=222, replication n=208): Cognitive deficit comparable to BT1, but a different neurophysiological profile. Ongoing neural activity is accentuated (not diminished), the P200 ERP is exaggerated, and performance on tasks requiring motor inhibition (antisaccade, SST) is the worst of any group. The defining signature is excessive background neural activity with poor inhibitory control.
Biotype 3 (B-SNIP1 n=226, replication n=232): Near-normal on most bio-factors, with modest deviations on cognition and the P200 ERP. Despite carrying a clinical psychosis diagnosis, these cases resemble healthy participants across the biomarker panel.
The canonical discriminant analysis for biotypes yielded two significant functions, unlike the single function for DSM diagnoses. The first function captured “Neural Response Magnitude” (BT1 at the deficit extreme), and the second captured “Neural Disinhibition” (BT2 at the extreme of overactivity and poor inhibition). The resulting centroid separations in two-dimensional space ranged from 2.07 to 2.64 standard deviations… substantially larger than anything achievable with DSM diagnoses.
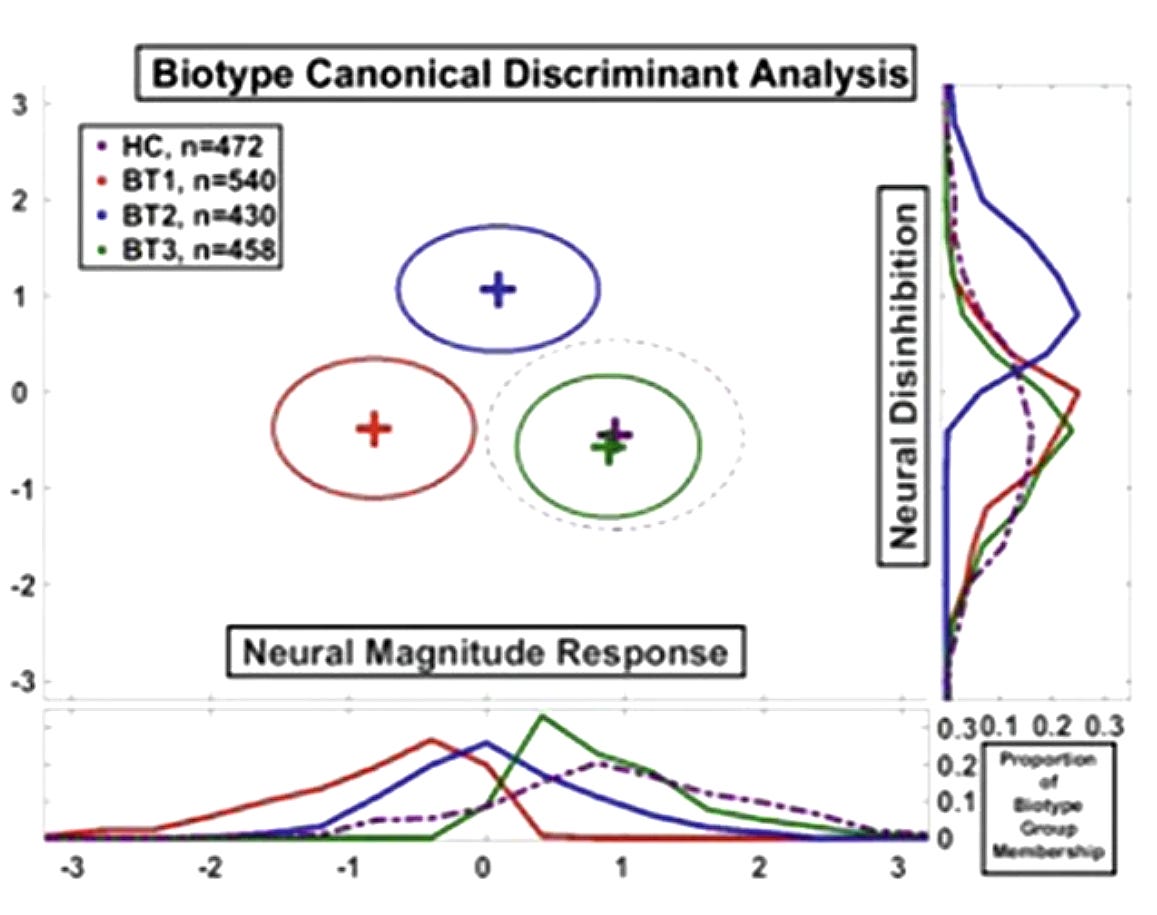
Biotypes 1 and 2 share severely impaired cognition but seem to arrive there through opposite physiological routes. One brain under-responds; the other is struggling with its own background noise.
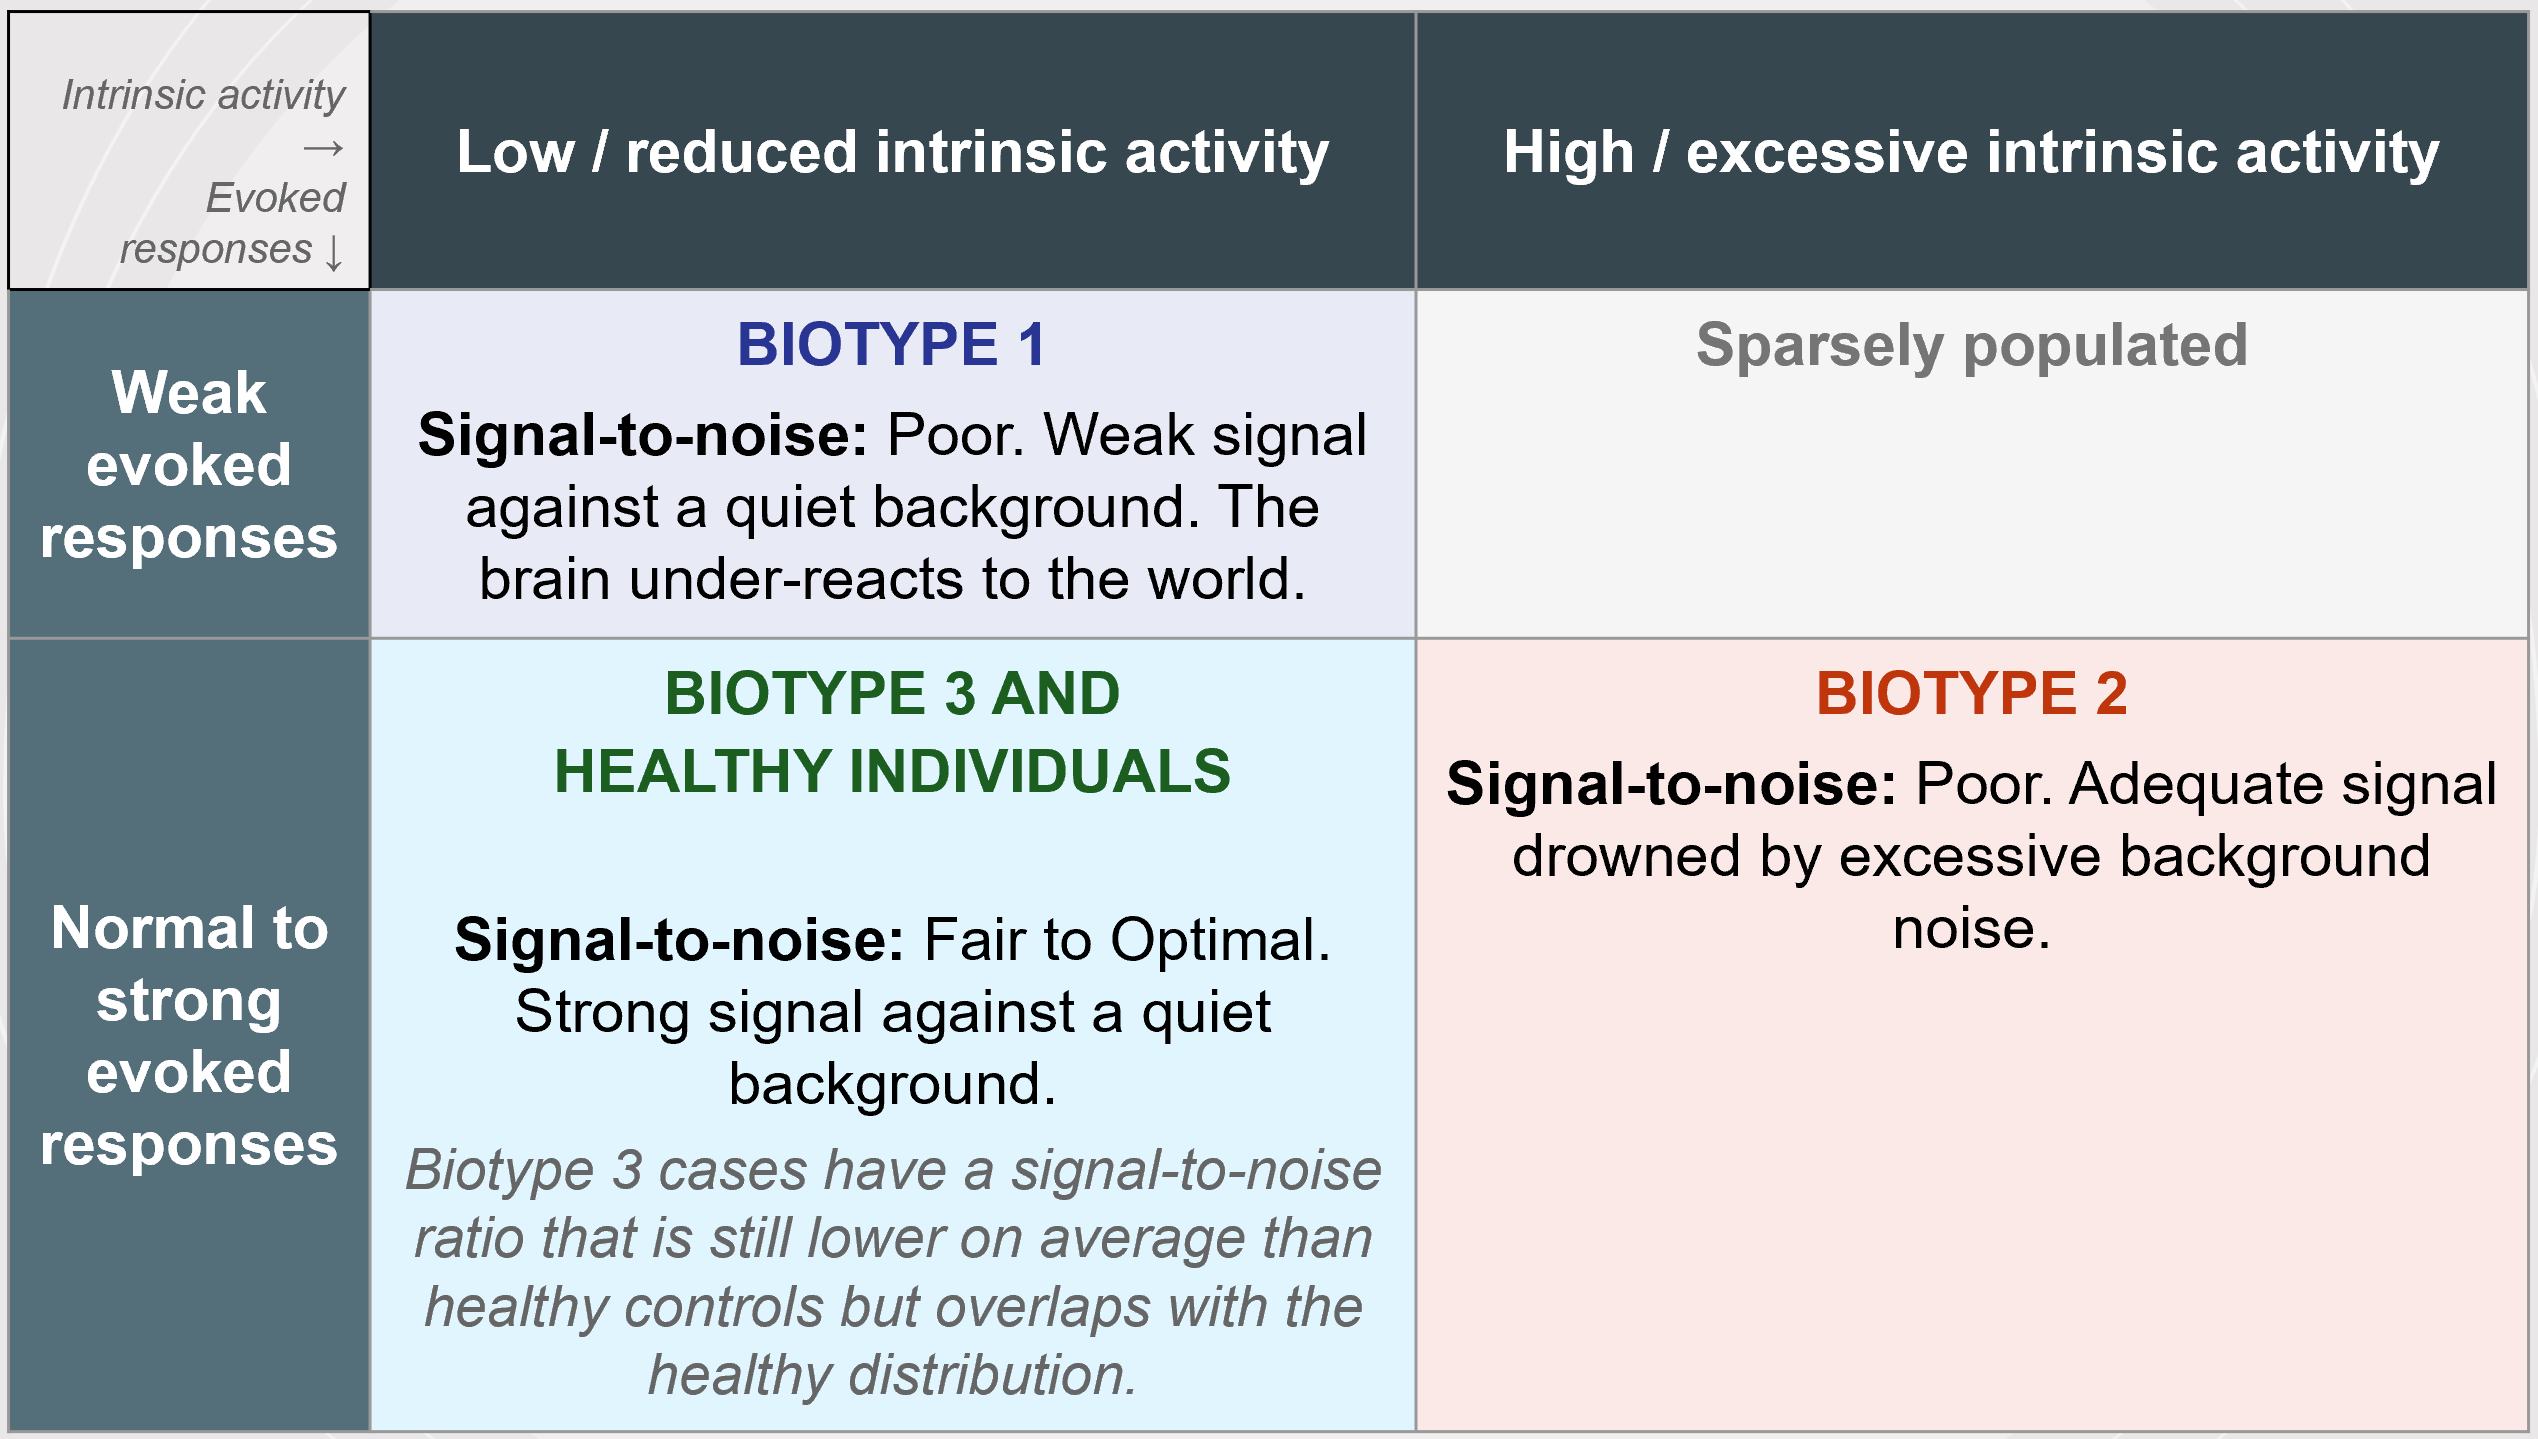
From my perspective, we can also visualize this as a 2x2 diagram:
It is notable here that the biotypes do not map onto DSM diagnoses. All three diagnoses appear in all three biotypes. About a third of schizophrenia and schizoaffective cases lack the cognitive impairment usually thought to define them, and a substantial number of bipolar cases carry cognitive deficits as severe as anyone’s.
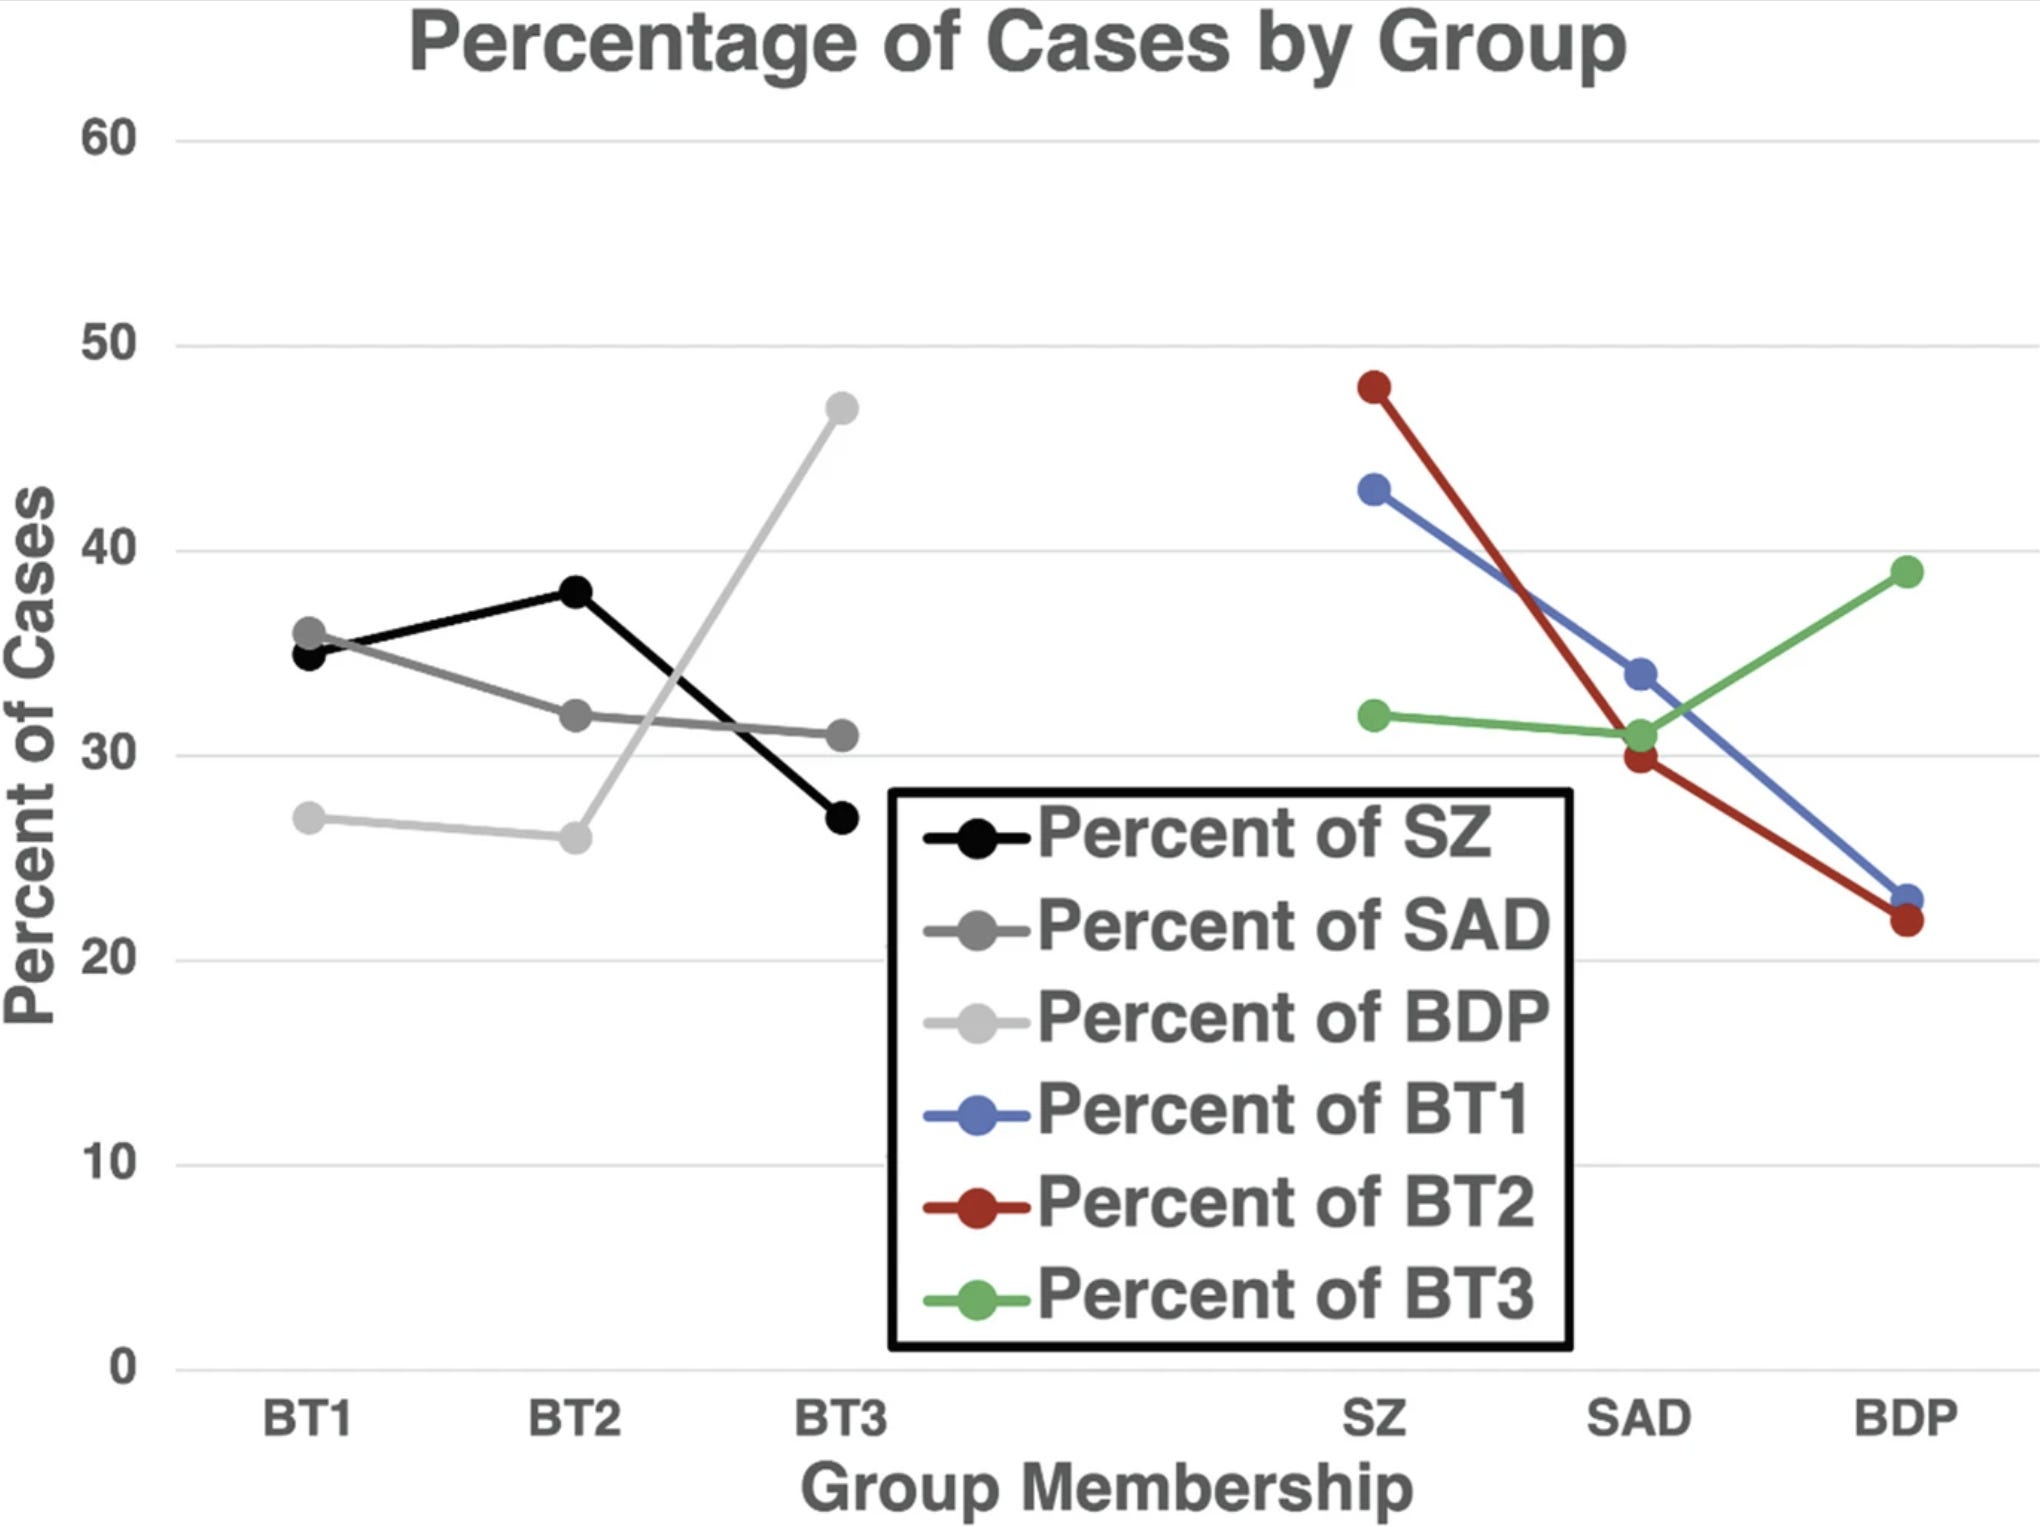
BT1 was predominantly schizophrenia (40.7%) and schizoaffective (42.3%). BT2 was largely schizophrenia (36.9%) but also contained substantial schizoaffective (21.8%) and bipolar (21.8%) fractions. BT3 was heavily bipolar (48.6%) but still included over 50% schizophrenia and schizoaffective cases.
External Validation
A clustering algorithm will always find clusters if you ask it to, so the real test is whether the biotypes differ on measures that were not used to build them. Reassuringly, they do. The biotypes differ on structural and functional brain imaging, on white matter microstructure, on inflammatory markers, and on clinical and social functioning, none of which went into the original clustering.
The strongest evidence for the reality of biotypes came from measures not used in their construction. Two independent measures were deployed:
Intrinsic EEG Activity: Background EEG recorded during the 9–10 second inter-pair intervals of the paired-stimuli task, when no stimuli were presented and subjects had no task. All empirically derived frequency bands significantly differentiated biotypes (BT1 low, BT2 high) but failed to differentiate DSM diagnoses. This directly confirmed the core physiological distinction between biotypes 1 and 2.
Auditory Steady State Response (40 Hz): In a subset of 437 participants, prolonged 40-Hz stimulation of auditory cortex replicated all three key findings. The N100 onset response was diminished in BT1 (consistent with dampened neural responding). The P200 was accentuated in BT2 (consistent with excessive neural activity). And the sustained 40-Hz oscillatory power during stimulation was low in BT1 and high in BT2, mirroring the intrinsic activity pattern exactly.
Stability Over Time, and the Signal in Relatives
B-SNIP re-measured participants at baseline, six months, and twelve months. The bio-factors were highly stable across that year, with reliability coefficients ranging from 0.76 to 0.95, and the cognition bio-factor was the most stable of all at 0.95. These are trait-like measures.
The researchers also showed that medications could not account for the group differences; across hundreds of analyses, drug use explained almost none of the variance in the biomarkers.
There is also a familial signal. In the original B-SNIP sample, every psychosis case had at least one first-degree biological relative enrolled, and those relatives showed the same bio-factor patterns as the patients they were related to. When cognition is plotted against brain structure and physiology, patients, their relatives, and healthy people all fall along the same underlying function. Bio-factors appear to be tapping into something heritable rather than something produced by the illness itself.
Clinical Recognition of Biotypes
The full B-SNIP biomarker battery is inaccessible in the vast majority of clinical settings, so the consortium developed an algorithm, called ADEPT, that estimates a person’s biotype from a much smaller set of measurements available in a clinical setting.
The first version, ADEPT-CLIN, uses only clinical ratings, the kind any clinician can gather from an interview. With just 10 to 11 such ratings, it assigns biotypes with an accuracy (area under the curve) of about 0.80. The top clinical discriminators, in order of importance, are difficulty in abstract thinking, social functioning (including occupational involvement and prosocial behavior), conceptual disorganization, severity of hallucinations, stereotyped thinking, suspiciousness, unusual thought content, lack of spontaneous speech, and severity of delusions.
How do these features differ across the three biotypes? On these items, biotypes 1 and 2 score more abnormally than biotype 3, and biotype 2 is marginally the most clinically deviant of the three. For instance, on PANSS difficulty in abstract thinking (scored on a 1-to-7 scale), Biotype 2 averages 3.25, Biotype 1 averages 3.04, and Biotype 3 averages 2.46. On conceptual disorganization: BT2 scores 2.38, BT1 scores 2.16, BT3 scores 1.77. On suspiciousness: BT2 scores 3.23, BT1 scores 2.93, BT3 scores 2.65.
The BT1-to-BT2 gap on these clinical features is small, usually just 0.1 to 0.3 points on a 7-point scale. The BT1/BT2-to-BT3 gap is much larger. So the clinical interview mainly separates the cognitively impaired biotypes from the near-normal one. Yet those two biotypes, as the investigators point out, “apparently come by their clinical pictures via different physiologies.” The second version of the algorithm, ADEPT-COG, adds a handful of cognitive tests and pushes accuracy up to about 0.95 for distinguishing one biotype from the rest. That is a large gain, and it makes biotype estimation feasible in real clinical and research settings.
These clinical features are not the same as the ones that best distinguish DSM diagnoses. The top DSM discriminators are indicators of physiological dysregulation (reduced need for sleep, excitement, anxiety, somatic complaints, lassitude), not the cognition-and-social-functioning cluster that separates the biotypes. The algorithm is adaptive: the items assessed, and the order in which they are assessed, are unique to each individual case.
Treatment Implications
Consider the idea of signal-to-noise ratio. The brain has to generate a clear response to meaningful events against a background of ongoing activity. Biotype 1 has a weak signal against a quiet background; the brain under-reacts to the world. Biotype 2 has an adequate signal that is drowned out by excessive background noise. Both end up with poor signal-to-noise, but for different reasons; this would be suggest that one needs interventions to boost the signal in biotype 1 and to quiet the background noise in biotype 2. A sensory training program has shown early, preliminary evidence of enhancing brain responses in biotype 1 cases and could perhaps adapted for reducing background noise as well.
The clearest example of potential clinical application involves clozapine, the most effective antipsychotic but one that is severely underused because of its side effects and monitoring requirements. Clozapine uniquely increases alpha and theta EEG power, the frequencies that are deficient in biotype 1. In cross-sectional data, biotype 1 cases taking clozapine had intrinsic activity comparable to normal, healthy levels, whereas biotype 2 and 3 cases on clozapine were driven further from normal. This raises the possibility that biotype 1 may respond particularly well to clozapine, a question that is now being tested in a clinical trial.
An Analogy: Kidney Function and Insulin Resistance
How should we make sense of what these biotypes are? Here I think an analogy from general medicine would be useful. The analogy is far from perfect but hopefully close enough to be illustrative. (If you can think of a better analogy, let me know!)
Imagine having a large sample of people with a mix of urinary and metabolic problems and plotting two continuous biological dimensions against each other. On one axis, kidney filtration, measured by eGFR, running from normal to low. On the other axis, insulin resistance, running from normal sensitivity to high resistance. This produces four regions on a 2x2 table.
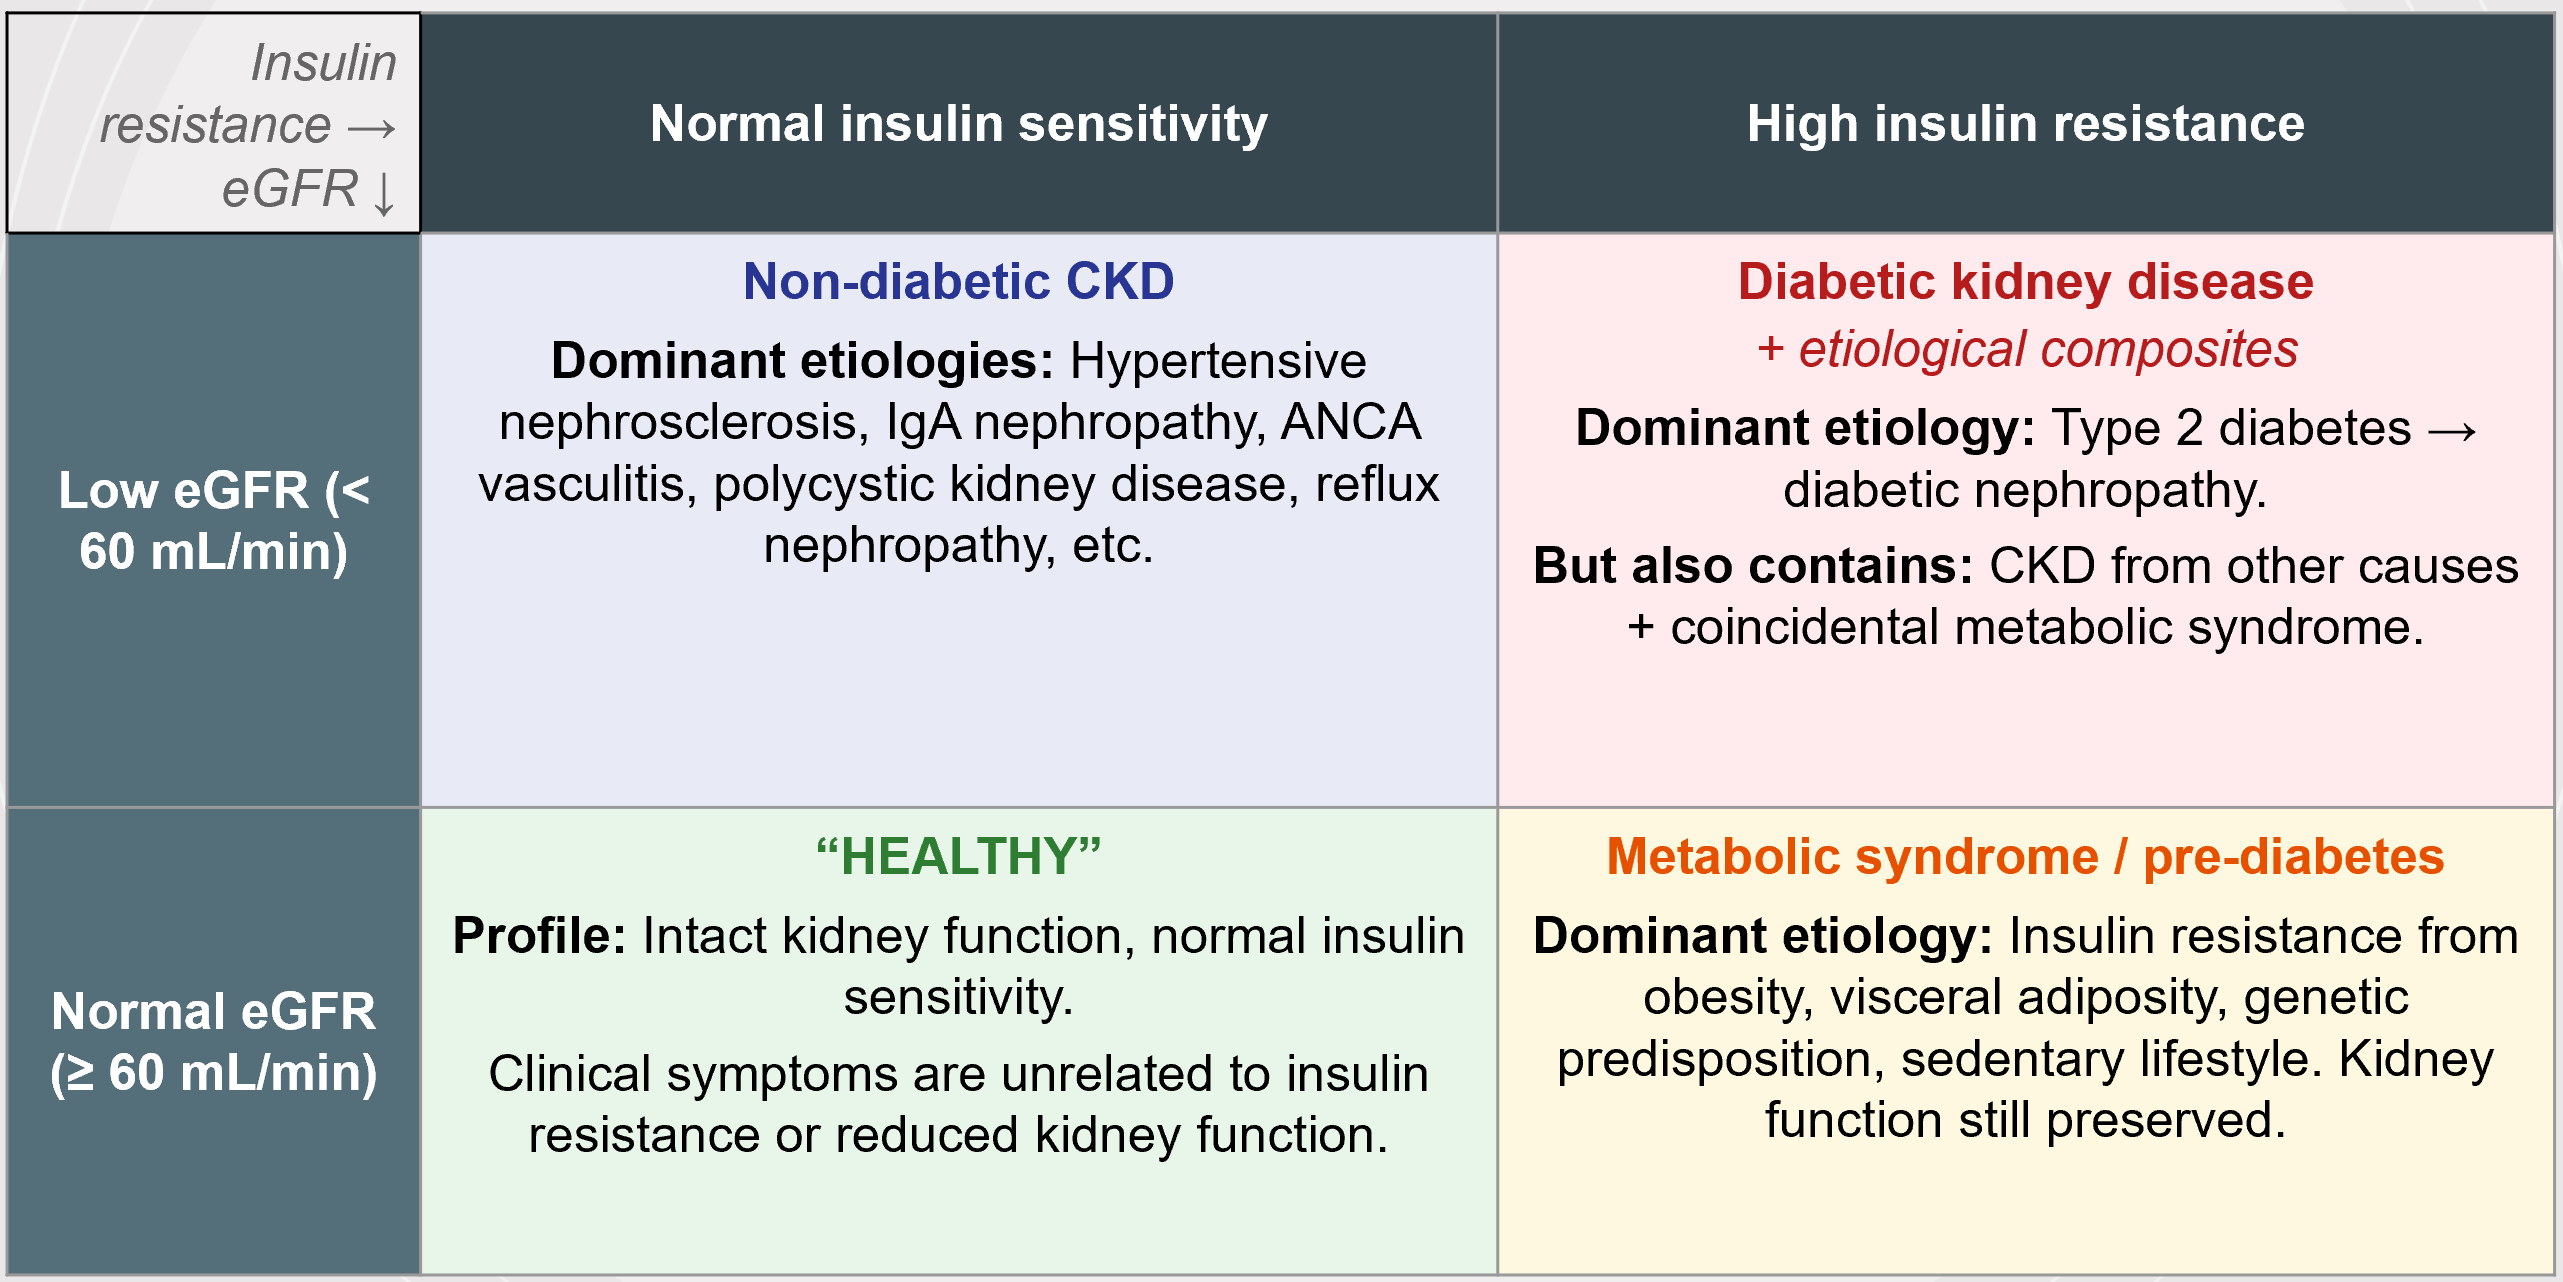
People with normal kidney function and normal insulin sensitivity are, roughly, “healthy.” They may have urinary symptoms but these symptoms are unrelated to eGFR and insulin sensitivity. People with high insulin resistance but preserved kidney function have something like metabolic syndrome or pre-diabetes. People with low eGFR but normal insulin sensitivity have non-diabetic chronic kidney disease, with many separate causes (hypertensive nephrosclerosis, IgA nephropathy, ANCA vasculitis, polycystic kidney disease, reflux nephropathy, etc, etc).
There is a corner where eGFR is low and insulin resistance is high. The dominant story there is diabetic kidney disease, that is, type 2 diabetes leading to diabetic nephropathy. But that corner is not pure. It also contains people with kidney disease from other causes who happen to also have metabolic syndrome.
In this analogy, biotype 3 will correspond to the “normal eGFR, normal insulin sensitivity” cluster. Both have clinical symptoms but for reasons unrelated to these particular biological dimensions.
So what is “low eGFR plus high insulin resistance” cluster? It is a biological region defined by the intersection of two dimensions. It shows real, non-accidental clustering of cases, and it has fuzzy boundaries. It is heterogeneous enough that no single causal story explains every case in it. And yet it contains a dominant etiology, diabetic kidney disease, coherent enough that studying and treating that region is genuinely productive.
My suspicion is that B-SNIP biotypes 1 and 2 are, conceptually, the same kind of thing as the “low eGFR plus high insulin resistance” cluster. They are biological regions defined by the intersection of multiple dimensions. They show non-accidental clustering and fuzzy boundaries. They are very likely heterogeneous enough that no single causal story will explain all the cases in any one biotype. But they may well have enough etiological coherence within the clusters that research and treatment can be productive.
Let’s say it’s 2036 and the B-SNIP biotypes have scientifically “flopped.”
What could have led to this sort of outcome? In my mind, there are 2 major possibilities.
One. It may be the case that for various methodological reasons that are above my pay grade, we have over-interpreted the clusters arising from the intersection between “Neural Response Magnitude” and “Neural Disinhibition,” and in reality, there is just a single continuum of cognitive and neurophysiological severity. Maybe. But even if that turns out to be the case, the neurocognitive spectrum still provides a stable neuroscientific foundation not provided to us by clinical categories, and not all would be lost. We can still meaningfully characterize patients across the psychosis spectrum based on their cognitive and neurophysiological profiles. The neurobiological architecture would be dimensional rather than taxonic but there would still be an architecture to work with.
Two. It may turn out that the biotypes are robust and highly replicable biological clusters but sadly they do not correspond to anything clinically useful. The clozapine-biotype 1 hypothesis fails. Sensory training goes nowhere. That would be disappointing, and these things are hard to predict. Who can say. Still, once we have discovered a stable architecture beneath psychosis, even if it doesn’t lend itself to clinical application in the near future, perhaps because we don’t have the right tools or the right interventions, there is always the possibility that somewhere down the road, unexpected utility may emerge. In 2050, e.g., a hypothetical new treatment developed for psychosis and undergoing RCTs could be found to be effective along BSNIP biotypic lines.
Even granting the reality of B-SNIP biotypes, there is still a lot we don’t know. We are very far from a scientific theory of how psychotic symptoms emerge or how they relate to the neurophysiological and cognitive features. We do not know how trauma, social adversity, cannabis use, infectious exposures, personality functioning, etc, relate to biotypes. We have not “solved” the neuroscience of psychotic disorder, any more than recognizing the “low eGFR plus high insulin resistance” cluster provides us with an etiology of diabetic kidney disease. I am personally hopeful that the “signal-to-noise” ratio framing of biotypes provides a productive link to computational models of psychosis.
It is clear to me that B-SNIP are not disease entities akin to measles or Hungtington’s disease. But we may be a bit closer to something like chest pain with or without ST elevation on EKG (with or without the clinical utility!). It is a start. It is stable rocky ground in a desert of shifting sands.
The two key reference papers for my discussion are:
Clementz, B. A., Parker, D. A., Trotti, R. L., McDowell, J. E., Keedy, S. K., Keshavan, M. S., ... & Tamminga, C. A. (2022). Psychosis biotypes: replication and validation from the B-SNIP consortium. Schizophrenia Bulletin, 48(1), 56-68.
Clementz, B. A., Assaf, M., Sweeney, J. A., Gershon, E. S., Keedy, S. K., Hill, S. K., ... & Pearlson, G. D. (2024). Categorical and dimensional approaches for psychiatric classification and treatment targeting: considerations from psychosis biotypes. Neurophysiologic Biomarkers in Neuropsychiatric Disorders: Etiologic and Treatment Considerations, 685-723.
This post is dedicated to Dr. Godfrey Pearlson, who, during my trip to the Institute of Living (Hartford, CT), helped me see the significance of B-SNIP biotypes in a way I had not appreciated before.
See also:

Thank you! It is so very important to highlight such progress not only because of whatever intrinsic value it may have (regarding 'the facts of the matter') but also because it provides a crucial reminder of how little is yet known. It is valuable to see both things framed in this positive, future-focused, way.
Sometimes it feels like every researcher in psychiatry should have the physicist A.A. Michelson's (in)famous quotation from the end of the 19th century proudly displayed: “it seems probable that most of the grand underlying principles have now been firmly established.” (Over the next few decades (and in no small part due to Michelson’s own work), fundamental physical theory underwent its most dramatic changes since the times of Galileo and Newton.)
I'll go ahead and bet on 'flopped' by 2036. With confidence. But flopping isn't actually a flop. We move forward in tiny steps, and the failure of each step brings on the next, and each next step bears the fingerprint of the previous one.
This was a good read and I hope it improves treatment. Type 2 sounded really familiar to me as an AuDHDer and I wonder if that suggests similar features that could help explain why autistic people are most likely to have some sort of psychotic features at some point in our lives and why autistic catatonia patients are likely to be harmed rather than helped by antipsychotics.
Also, my motor inhibition is truly awful but I've never had a clinician evaluate or care about that, even though I think it's probably more closely related to my most-severe executive functions than the things like mood, anxiety, sleep, or focus that clinicians always try to steer the conversation toward. Like, my problem is that I cannot inhibit repetitive behaviors like scrolling no matter how much I want to, and I cannot initiate voluntary behaviors without external structure or stimulation factors that I can't control, and I, like many other people with autistic inertia, think those are due to the same underlying mechanism. Guanfacine was a miracle cure for that for about a week, but efficacy has been greatly reduced (alongside side effects) with tolerance. Anyway, I was excited that these researchers are taking impaired motor inhibition as an important thing to look for.